Conference Data Dashboard

Exploring the Dashboard

Interactive Tips

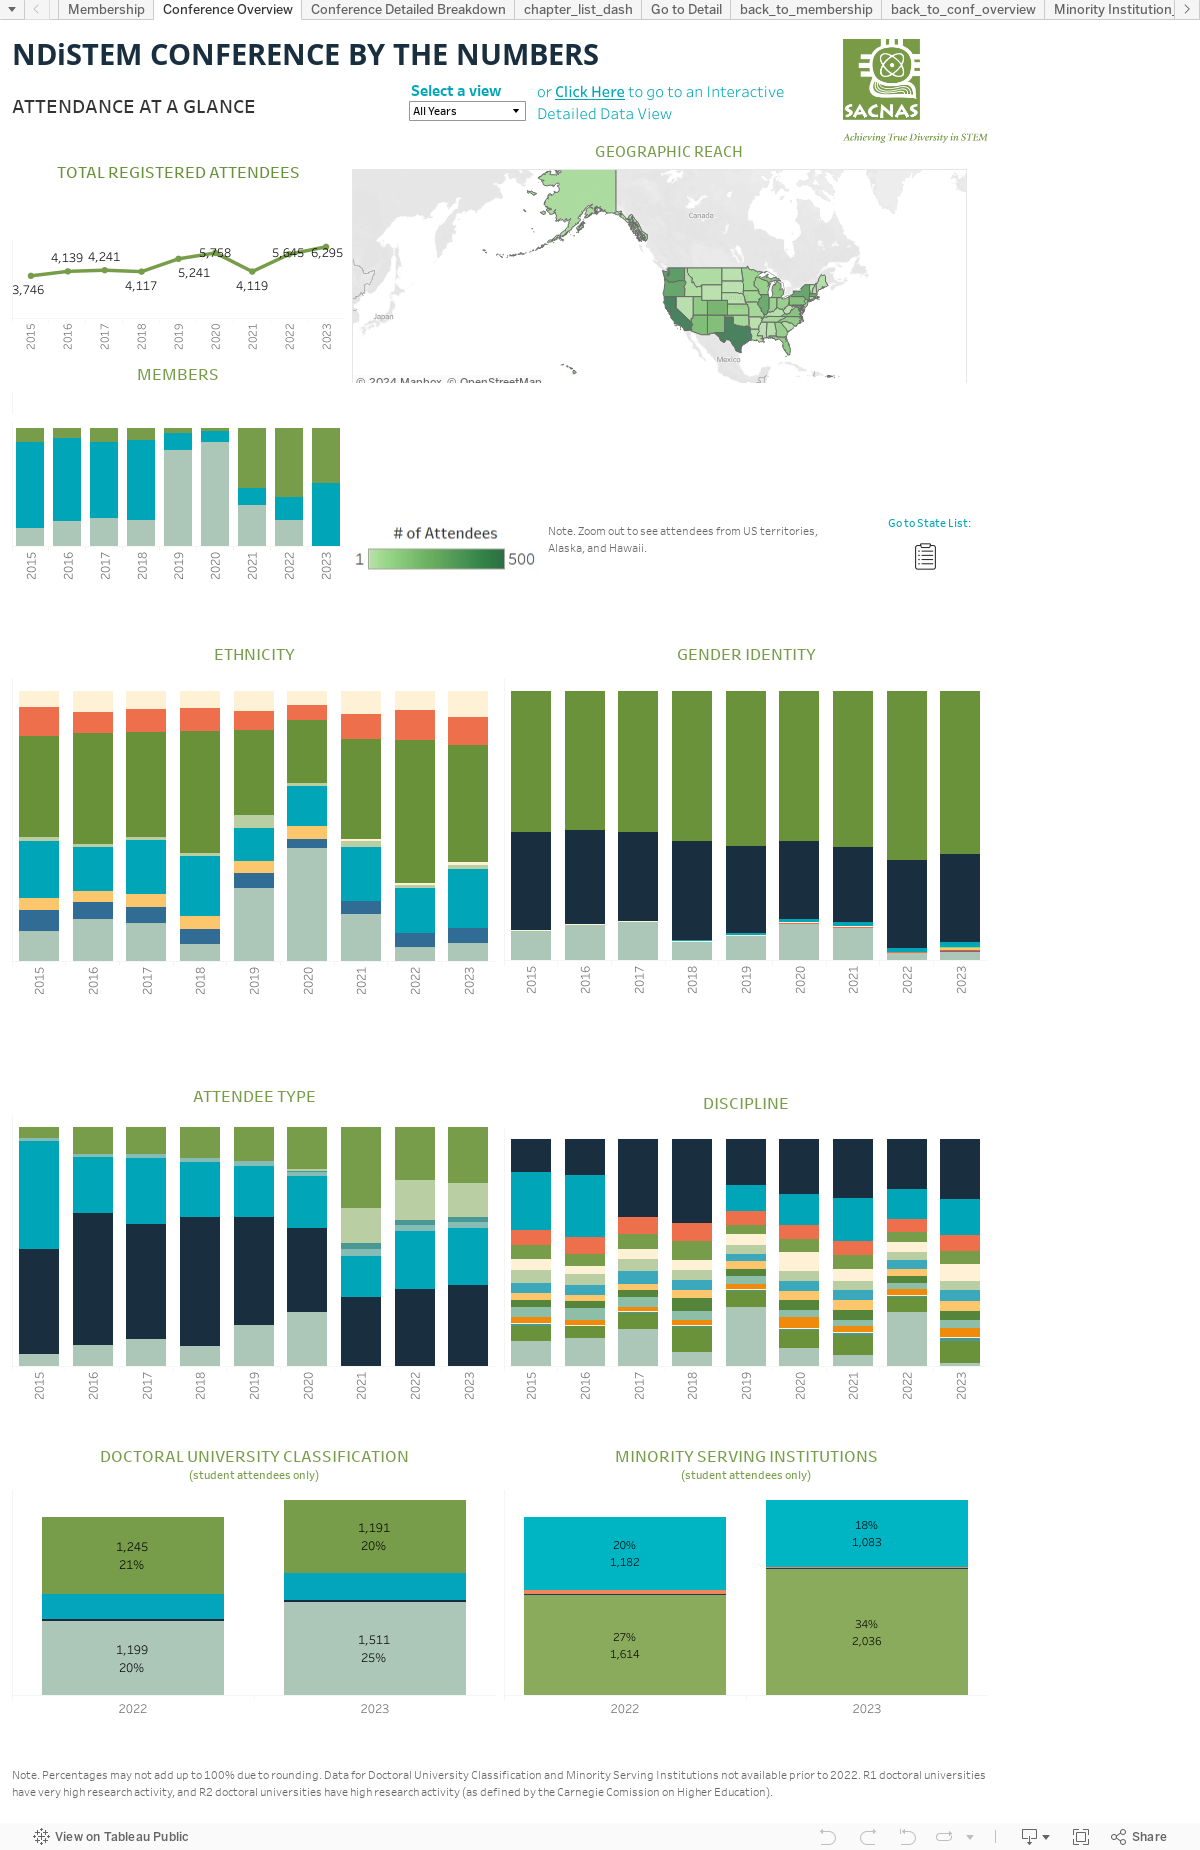
  • Hover over the charts for more information.

  • Click on any chart to be led to a table view.

    • Page may appear blank, please scroll up.

  • To return back to the main dashboard, click anywhere on the table or use your browser's back button.

  • If it seems like the chart is grayed out except for one section, just click on that section and it will revert to it's original view.

  • Click "Select a view" to switch between all year data and latest year data.


If you have any questions or comments, please contact us at info@sacnas.org.

Mobile View

Click on one of the buttons below to see the preferred view. Please note that the dashboard is best viewed on a desktop as not all features can be viewed on mobile devices.

Latest Year              All Years

Methodology

The demographic data is collected during registration of the NDiSTEM Conference. Ethnicity, gender identity, and discipline are single select, and "Other" responses were fill in the blank. The classification of the doctoral university data was developed by the Carnegie Commission on Higher Education. Minority serving institute classifications (TCU, HSI, and HBCU) are identified by the U.S. Department of Education. 

The data for this dashboard begins in 2015 as that is the year registration questions were streamlined and adopted the current structure.


View our information on our past conferences here.


Stay In Touch

Sacnas - Logo 1

Copyright 2022 SACNAS.

Non-Profit Website by Ironpaper